What do the food ratings tell us about restaurants and health departments?
Every restaurant in NYC receives a letter grade by the city. Using this information we can draw insights into safety and where to eat.
Anyone who’s been to New York City likely noticed the restaurant letter grades on virtually all eating establishments. The letter grades were introduced in 2010 and range from A through C, with A being the highest (best) rating. Restaurants are required to clearly display the letter grade although some establishments get creative.
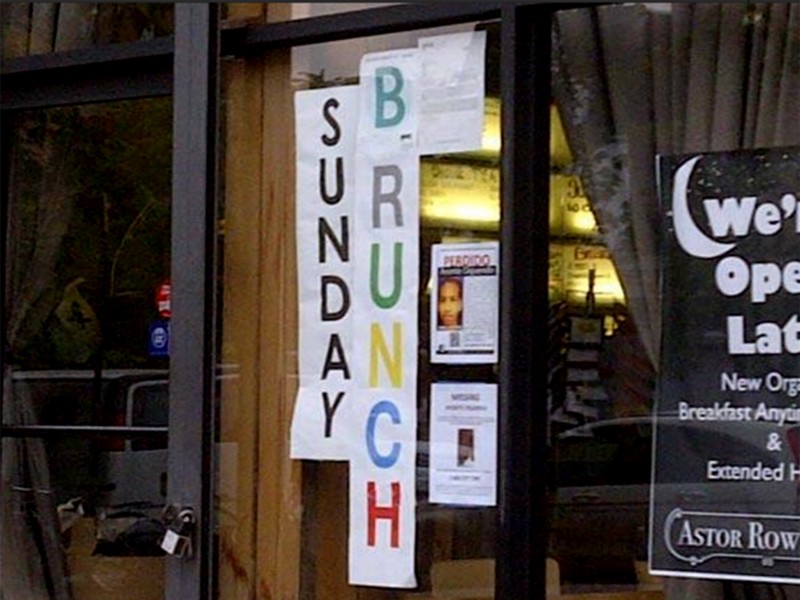
The 'B' is for Brunch!
I was always curious about the ratings and since the data is available online, I figured I’d test it out myself. TLDR: Inspectors prefer not to give grades other than As, don’t like to work weekends, and chain restaurants are quite clean. And there is one mystery that I was unable to crack (skip to the end about how often restaurants get reviewed). All the code can be found here.
The boring stuff
The data (186,185 rows, 12 columns):
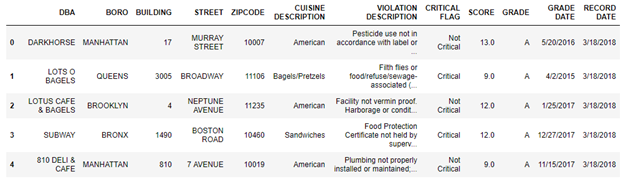
DBA is the restaurant name, and the rest is self-explanatory. The restaurant naming wasn’t always consistent (e.g. Starbucks vs Starbucks Coffee) so I had to clean it up a bit.
The data set provided historical ratings for each restaurant as well as the most recent ratings. But ratings are also broke down ratings into critical and not critical categories. So a single rating will have two rows, one for the critical violations, and another with the non-critical violations. So I removed the information regarding the violation description/type and removed duplicates.
Since the data set contains historical information, I also created a unique key for each individual restaurant. I did this by creating a value combining the restaurant name, building, street and zip-code (e.g. DARKHORSE 17 MURRAY STREET 10007).
What is the breakdown of the grades?
The score is from 0 and up. A low score is good as it indicates no violations. Each violation has some point value so a score of 0 means there are no violations. There are three types of violations:
- General — e.g. not properly sanitizing cooking utensils — min 2 points
- Critical — e.g. serving raw food such as a salad without properly washing it first — min 5 points
- Public Health Hazard — e.g. failing to keep food at right temperature — min 7 points
The final grade is based on the sum of all the points.
- 0 to 13 earns an A
- 14 to 27 earns a B
- 28 or more earns a C
A breakdown of the grades can be seen below in percentage terms, grouped by the most recent grade and all grades.
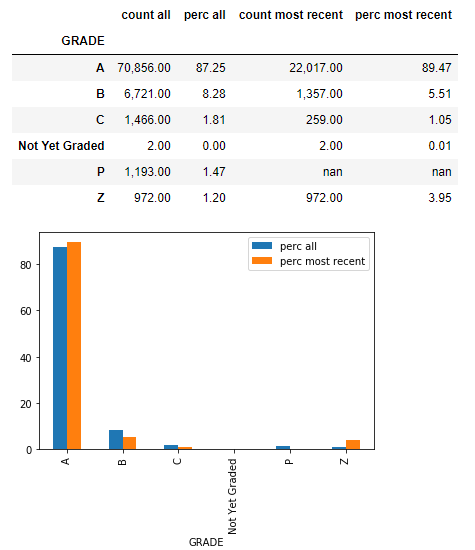
I’m not surprised that the majority of grades are As with less that 2% of inspections resulting in a C grade. How about the distribution of the numerical scores?

There is a steep drop-off on 14 points, at the cutoff from A to B. From the city’s website:
Two types of inspections result in a letter grade: initial inspections for which the restaurant earns an A and re-inspections that result in an A, B or C. A restaurant has two chances to earn an A in every inspection cycle. If it doesn’t earn an A on the first inspection, it’s scored but ungraded. An inspector goes back to the restaurant unannounced, typically within a month, to inspect it again and the re-inspection is graded. If the grade is a B or C, the restaurant will receive a grade card and a grade pending card. It can post either card until it has an opportunity to be heard at the Office of Administrative Trials and Hearings Health Tribunal. Until a restaurant has a graded inspection, it is listed as Not Yet Graded on the Health Department website.
So non-A grades aren’t initially reported and the restaurant has another chance. This suppresses the B and C grades reported. But the high number of scores right at the A to B cut-off is curious. My guess is that inspectors show leniency when nearing the cut-off threshold. If it’s close, the inspectors give the restaurant the benefit of receiving the higher grade since the letter grade is the most visible component to the customer. It could also be a consequence of the number of points assigned to each violation. For instance, critical violations are minimum of 5 and public health hazard are minimum of 7. So a score of 10 or 12 should be more common, which is what we see.
When do inspectors inspect?

Looks like food inspectors don’t like working weekends, especially Sundays. Oh, and they also take it easy in July.
Has there been grade inflation over the years?
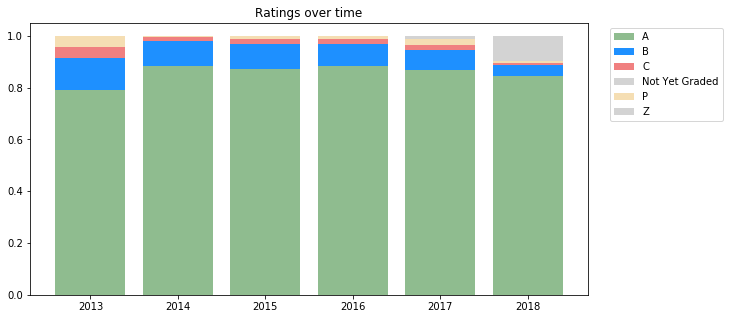
Eh, not really. The first year had only ~80% A ratings, but the sample size was only about 100. The B and C ratings have held steady at around 12% and 4%, respectively. So far this year there are a lot of Z or Not Yet Graded.
What restaurants have the best rating for their cuisine?
The data set has inconsistent names for cuisine description (e.g. 16 Handles is sometimes categorized as American and other times as Ice Cream). In this case, I used the most common cuisine description. I also excluded establishments with fewer than 50 ratings in total. A lower score is better (fewer violations).
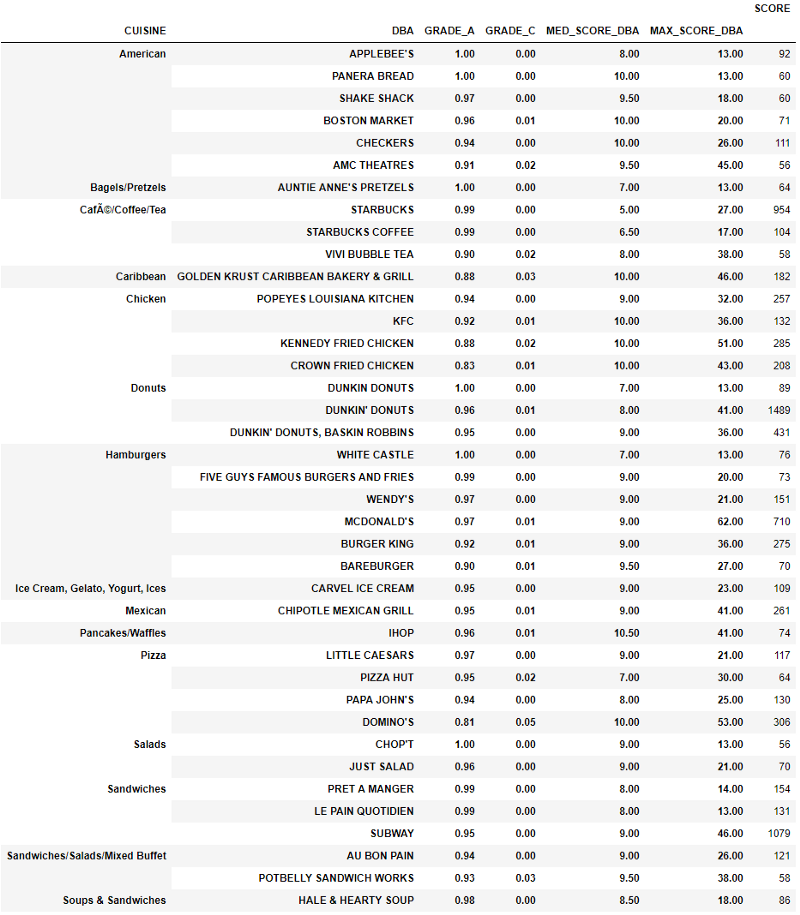
The ratings are surprisingly good, but I suppose that’s expected for large chains. Remember that a high score is bad. Some establishments like Applebee’s, Panera Bread and White Castle (!) have never received a public grade other than A. Other groups like Domino’s are very inconsistent and often bad (only 81% of their grades received are As and 5% are Cs). However, McDonald’s holds the dubious honors of having the worst (highest) score of 62 across the large restaurants.
How do ratings change over time for individual restaurants?
One way to consider this question is through a roll rate. A roll rate is the probability of transitioning from one state to another (or stay at the same state). I created a roll rate based on the probability of going from one rating to another (for a generalized simpler example of how to make a roll-rate, see this Stack Overflow question).
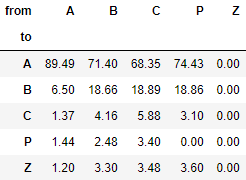
Around 90% of the time an A rating will again get rewarded an A on the next inspection. There is a 71% chance that a B restaurant will get awarded an A in the next rating, and a 68% chance a C restaurant will get awarded an A. This should be some comfort to those eating at B and C rated restaurants.
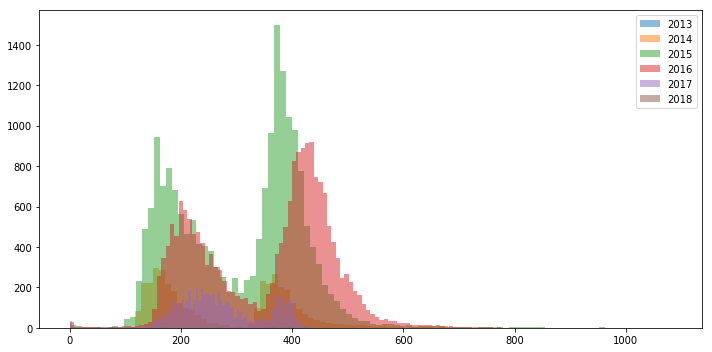
How often do restaurants stay at a given grade?
I looked at the time between reviews of each individual restaurant. I broke it down by grade since I figured that poorly graded restaurants get reviewed more often.

It’s not immediately obvious from the above, but the A grades have a bimodal distribution.

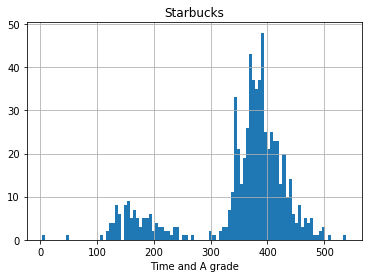
I spent some time trying to figure out what distinguishes but I never found a satisfying answer. The distribution of number of days with A-grade has been consistent throughout the years and across months. Its generally bi-modal over all cuisine types and across boroughs.
It’s somewhat correlated to how often the restaurant has been graded but not decidedly so (e.g. restaurants like Starbucks are almost all in the right peak). I may be missing something obvious, but my guess is that this is due to some of the scores that are not reported. As mentioned earlier, if a restaurant gets a grade other than a B, the score goes unreported and the restaurants gets another chance at an A within a month. My guess is that failing at this grading that goes unreported causes the restaurant to get reviewed more frequently. This explains why well rated restaurants get rated less often. Even if you look at restaurants that have never been awarded a grade below A, the bi-modal distribution exists, but that may only be because the non-A grades are unreported.
I’m open to other ideas.
It always existed
Large chains are still somewhat bi-modal
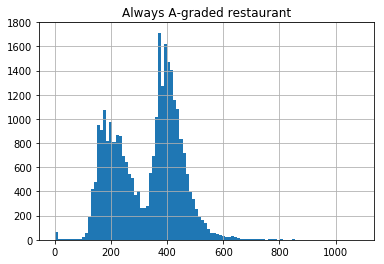
Even those with perfect grades are bi-modal

Bi-modal across months

No clear pattern between A-grade consistency and time at grade
By Branko Blagojevic on March 25, 2018