Nassim Taleb baits financial professionals and students into an elementary mistake in probability. However a simple check could have helped.
Probability and statistics is hard and not always intuitive. But with modern computing, we can run simulations to get the answers, or at least tell us when we’re way off. Here I describe such methods.
In anticipation of reading Nassim Taleb’s new book Skin in the Game, I came across a paper Taleb wrote titled “We Don’t Quite Know What We Are Talking About When We Talk About Volatility”. The paper focuses on the confusion between mean absolute deviation with standard deviation among financial professionals and academics. Mean absolute deviation of a series is the average of the absolute deviations from a central point while standard deviation is something less intuitive. The point is that they could both be used as a measure of dispersion or variation.
Statistics can be a very abstract discipline, even if its application is not. Sometimes hacking together a few lines of code to experiment is more productive to understanding than diving into probability theory and all of its pitfalls.
Taleb’s main purpose in life is to mock what he considers pseudo-intellectuals. As an experiment, he asks the question below to a group of financial professionals and students:
A stock (or a fund) has an average return of 0%. It moves on average 1% a day in absolute value; the average up move is 1% and the average down move is 1%. It does not mean that all up moves are 1% — some are .6%, others 1.45%, etc. Assume that we live in the Gaussian world in which the returns (or daily percentage moves) can be safely modeled using a Normal Distribution. Assume that a year has 256 business days. The following questions concern the standard deviation of returns (i.e., of the percentage moves), the “sigma” that is used for volatility in financial applications. What is the daily sigma? What is the yearly sigma?
By giving only one piece of relevant information (moves on average 1% a day in absolute value), he gives one obvious (incorrect) answer (1% standard deviation). The one piece of information is the mean absolute deviation which is different but related to standard deviation.

Considering that the survey is being administered by someone who has built a career antagonizing financial professionals and academics, I would shy away from taking the easy way out. But alas:
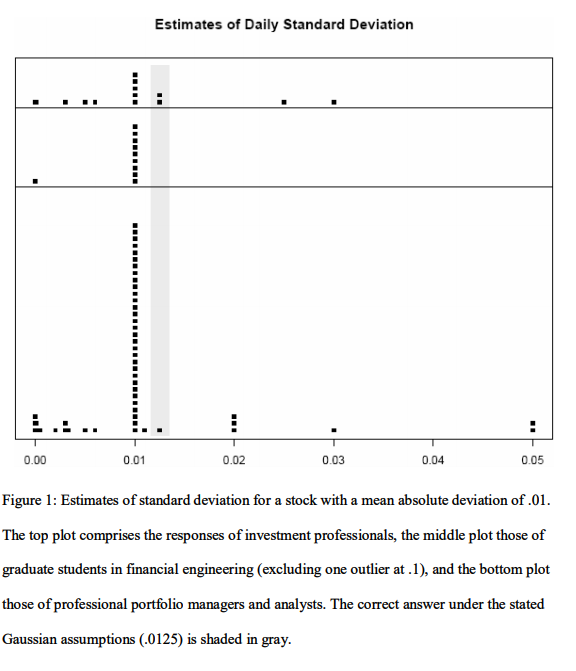
Confusing the concepts of mean absolute deviation and standard deviation is sacrosanct to Taleb. Not only that, but nearly everyone underestimates actual standard deviation by at least 25% and even 90% in fat tailed markets.
He uses the result to affirm his conclusion (and title of his paper) that we don’t quite know what we’re talking about when we talk about volatility. And this even applies to people who should know better, like financial professionals and students of financial engineering. It’s true that in the media complex mathematical concepts are thrown around unintelligibly as buzz words. I imagine if you performed a man on the street survey and asked for a definition of standard deviation the top answers might would be:
- No clue
- How much something moves every day on average
…
N. Root of the arithmetic mean of the squares of the deviation of each of the class frequencies from the arithmetic mean of the frequency distribution
Financial professionals and financial engineering students should know better, but this is still a tricky question, since only one piece of information is provided (mean absolute deviation) and there exists some function that converts mean absolute deviation to standard deviation. And in general people aren’t good at memorizing functions that cannot easily be derived.
But the question doesn’t have to be so tricky or even abstract. Using python we can easily verify our initial answer with a few lines of code. In our case, the mean absolute deviation is how much on average something moves in absolute terms. And we’re trying to solve for the standard deviation that would give us a mean absolute deviation of 1. So let’s try our initial guess of 1% standard deviation and calculate the mean absolute deviation.
import numpy as np
import matplotlib.pyplot as plt

np.random.seed(42)

random_points = np.random.randn(1000000)

print("mean: {:0.4f}".format(np.mean(random_points)))
print("standard deviation: {:0.4f}".format(np.std(random_points)))
print("mean absolute deviation: {:0.4f}".format(np.mean(np.absolute(random_points))))

mean: -0.0016
standard deviation: 1.0002
mean absolute deviation: 0.7983
The code above creates a million normally distributed points with a standard deviation of 1 and a mean of 0. This gives us a mean absolute deviation of ~0.8. This tells us that standard deviation of 1 would result in a mean absolute deviation of 0.8. If we look at a histogram of the two values, it becomes more obvious.
f, ax = plt.subplots(figsize=(7,5))

ax.hist(random_points, alpha=0.5, label=["returns"], bins=100)
ax.hist(np.absolute(random_points), alpha=0.5, label=["absolute returns"], bins=50)
ax.axvline(np.absolute(random_points).mean(), linestyle="dashed", color="red")

ax.set_xticks([-3,-2,-1,0,1,2,3])
ax.legend(prop={'size': 10})
f.tight_layout()
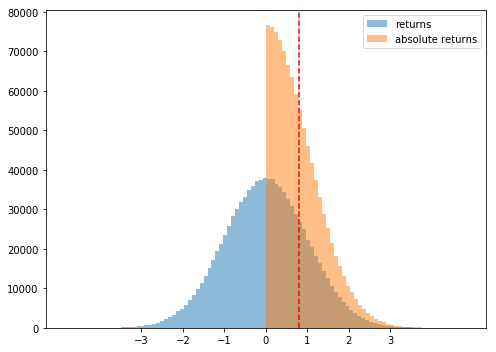
Since we’re trying to solve for a mean absolute deviation of 1, we need to increase the standard deviation. Now we know the relationship 1 standard deviation = 0.8 mean absolute deviation, we can just divide both sides by 0.8. This results in 1.25 (1 / 0.8) standard deviation = 1 mean absolute deviation. Let’s try that.
import numpy as np
import matplotlib.pyplot as plt

np.random.seed(42)

random_points = np.random.randn(1000000) * 1.25

print("mean: {:0.4f}".format(np.std(random_points)))
print("standard deviation: {:0.4f}".format(np.std(random_points)))
print("mean absolute value: {:0.4f}".format(np.mean(np.absolute(random_points))))

mean: 1.2502
standard deviation: 1.2502
mean absolute value: 0.9978
Sure enough, that lines up with the mathematically derived answer as provided by Taleb:
Our suspicion that there would be considerable confusion was fed by years of hearing options traders make statements of the kind, “an instrument that has a daily standard deviation of 1% should move 1% a day on average”. Not so. In the Gaussian world, where x is a random variable, assuming a mean of 0, in expectation, the ratio of standard deviation to mean deviation should satisfy the following equality ∑| x | x 2 ∑ = 2 π . Since mean absolute deviation is about .8 times the standard deviation, in our problem the daily sigma should be 1.25% and the yearly sigma should be 20% (which is the daily sigma annualized by multiplying by 16, the square root of the number of business days).
And how would we get the annual standard deviation?
np.random.seed(42)

# Create 1 million random normal points for 256 days
random_points_daily = np.random.randn(1000000, 256) * 1.25

# Convert to percentages:
random_points_daily /= 100

# Convert to returns:
random_returns_daily = 1 + random_points_daily

# Annualize (take the product of each day for the 1 million points):
random_points_annualized = np.product(random_returns_daily,axis=-1)

print(“Standard deviation of annualized returns: {:0.4f}”.format(np.std(random_points_annualized)))

Standard deviation of annualized returns: 0.2019
Or, just multiply by square root of 256.
My point is not that professionals and students don’t need to know statistics, but that it’s crucial to write tests to check our answers. Statistics and probability are tricky and not always intuitive. Consider the definition of t-statistic:
The ratio of the departure of the estimated value of a parameter from its hypothesized value to its standard error.
Technically correct, but there are many layers of abstraction to understanding what it effectively means. And to understand that well enough to make an assertion as to its implications is even harder.
Many times, we care more about ball-park estimates or validating our answers This is best done with experiments with random numbers. Tools like numpy and python make creating straight forward and intuitive tests easy. For more information, I recommend a great lecture from PyCon on hacking together answers to statistical questions through brute force.
I flipped a coin 6 times and it landed on 5 heads. How likely is this to happen?
from collections import Counter

np.random.seed(42)

num_trials = 1000000

random_coin_flips = np.random.randint(2, size=(num_trials,6))

coin_flips_counter = [Counter(flip) for flip in random_coin_flips]
coin_flips_5_heads = sum([1 for flip in coin_flips_counter if flip.get(0) == 5])
coin_flips_5_heads_perc = coin_flips_5_heads / num_trials

print("Percent 5 heads: {:0.4f}".format(coin_flips_5_heads_perc))

Percent 5 heads: 0.0937
Actual answer is 6 / 64 of 0.09375, since there are 6 ways to get 5 heads and 64 possible throws (2 ^ 6). But we knew that already.
HHHHHT
HHHHTH
HHHTHH
HHTHHH
HTHHHH
THHHHH
By Branko Blagojevic on March 12, 2018